Caption: UI Library School Alumni Newsletter - 21
This is a reduced-resolution page image for fast online browsing.
EXTRACTED TEXT FROM PAGE:
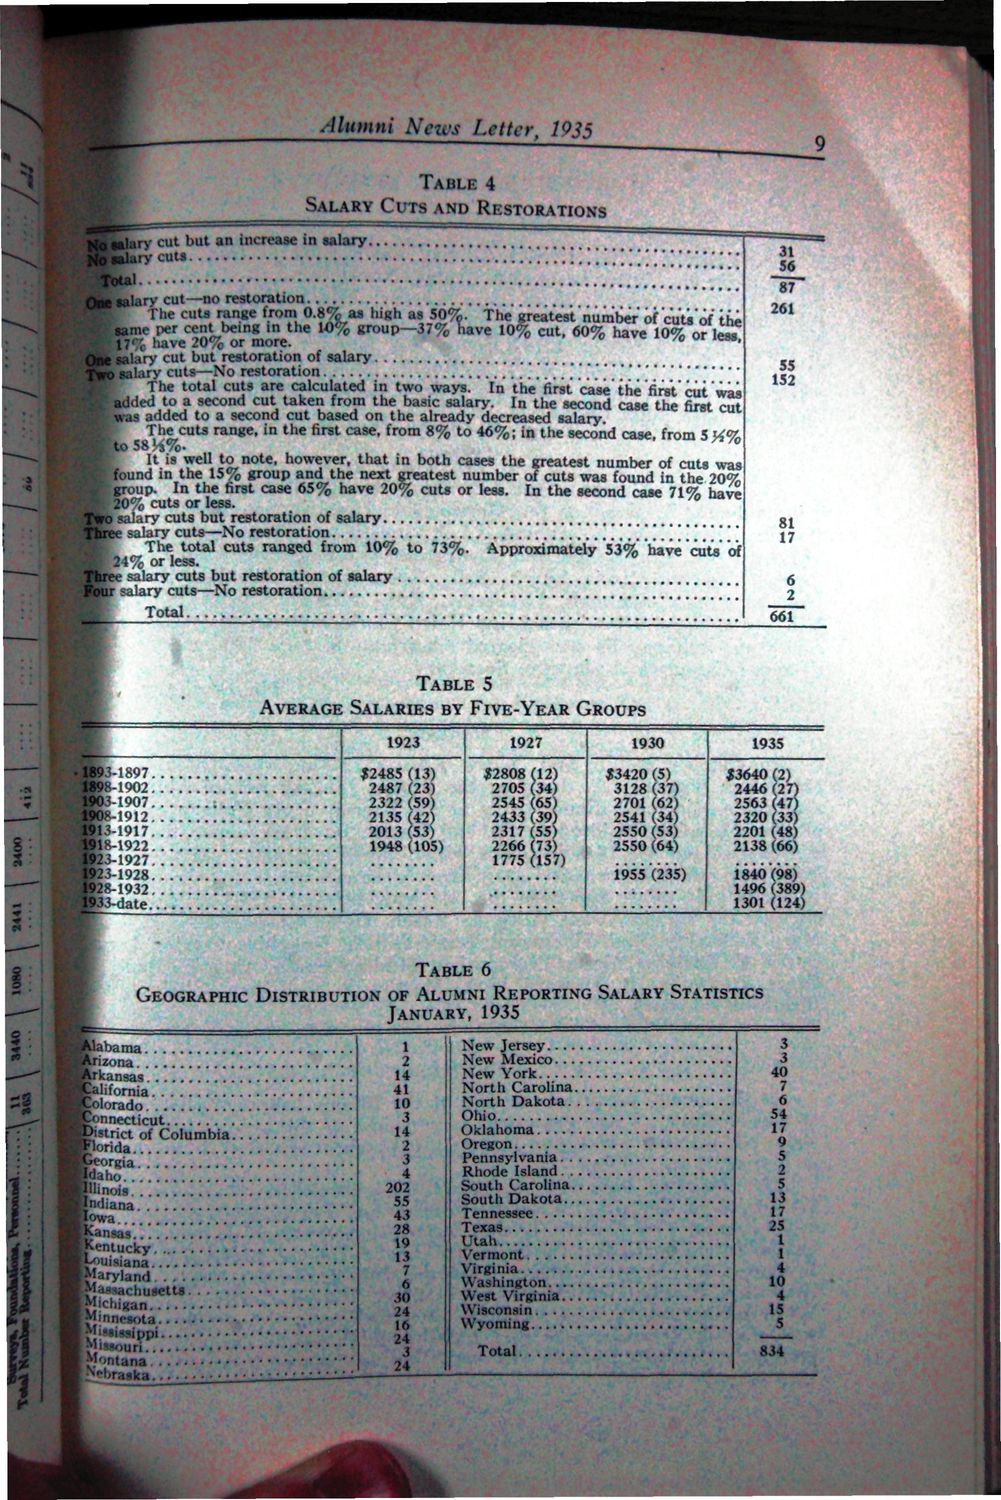
a* W^^t^ % * D • v ;*>• AlumniNezcs Letter, IQjj TABLE 4 SALARY CUTS AND RESTORATIONS No ttlarv cut but an increase in salary.. No salary cuts ....'..'..'. Total [[]'" One salary cut—no restoration Hie cuts range from 0.8% as high as 50%. The greatest'number of cuts'of the % £roup 37% W 10 cut W^lmvelok^r^^^'re ~ % ' ™% have 10% or less! One salary cut but restoration of salary Two salary cuts—No restoration \\\\ The total cuts are calculated in two ways. In the first case'the'first cut "was added to a second cut taken from the basic salary. In the second case the first cut wis added to a second cut based on the already decreased salary. The cuts range, in the first case, from 8% to 46%; in the second case, from 5 ^ % to 587a7b« It is well to note, however, that in both cases the greatest number of cuts was found in the 15% group and the next greatest number of cuts was found in the 20% group. In the first case 65% have 20% cuts or less. In the second case 71% have /0 20% cuts or less. Two salary cuts but restoration of salary Three salary cuts—No restoration The total cuts ranged from 10% to 73%. Approximately 53% have 'cuts' of 2 4% or less. Three salary cuts but restoration of salary Four salary cuts—No restoration !....!!!!!!! • 55 152 81 17 6 2 Total TABLE 5 AVERAGE SALARIES BY FIVE-YEAR GROUPS 1923 1893-1897 1898-1902 1903-1907 190> 1912 1913-1917 1918-1922 1923-1927 1923-1928 1928-1932 1933-date, $2485 2487 2322 2135 2013 1948 (13) (23) (59) (42) (53) (105) 1927 $2808 (12) 2705 (34) 2545 (65) 2433 (39) 2317 (55) 2266 (73) 1775 (157) 1930 $3420 (5) 3128 (37) 2701 (62) 2541 (34) 2550 (53) 2550 (64) 1955 (235) 1935 $3640 2446 2563 2320 2201 2138 1840(98) 1496 (389) 1301 (124) TABLE 6 GEOGRAPHIC DISTRIBUTION OF ALUMNI REPORTING SALARY STATISTICS JANUARY, 1935 Alabama Arizona Arkansas California |Colorado nnecticut District of Columbia [Florida ( or 1 2 14 41 10 3 14 2 3 4 202 55 43 28 19 13 7 6 30 24 16 24 3 24 9 ' ««a Maho Illinois Indiana Iowa Kansas Kentucky Louisiana Maryland Massachusetts. . • • M'chiKan Minnesota Jli*i4iPippi Missouri Montana .^"^raska New Jersey New Mexico... New York North Carolina North Dakota. Ohio Oklahoma Oregon Pennsylvania. . Rhode Island . South Carolina. South Dakota.. Tennessee Texas Utah Vermont Virginia Washington.... West Virginia.. Wisconsin Wyoming Total 17 9 5 2 5 13 17 25 1 1 4 10 4 15 5 834 3 3 40 7 6 54
|