Caption: Board of Trustees Minutes - 1970
This is a reduced-resolution page image for fast online browsing.
EXTRACTED TEXT FROM PAGE:
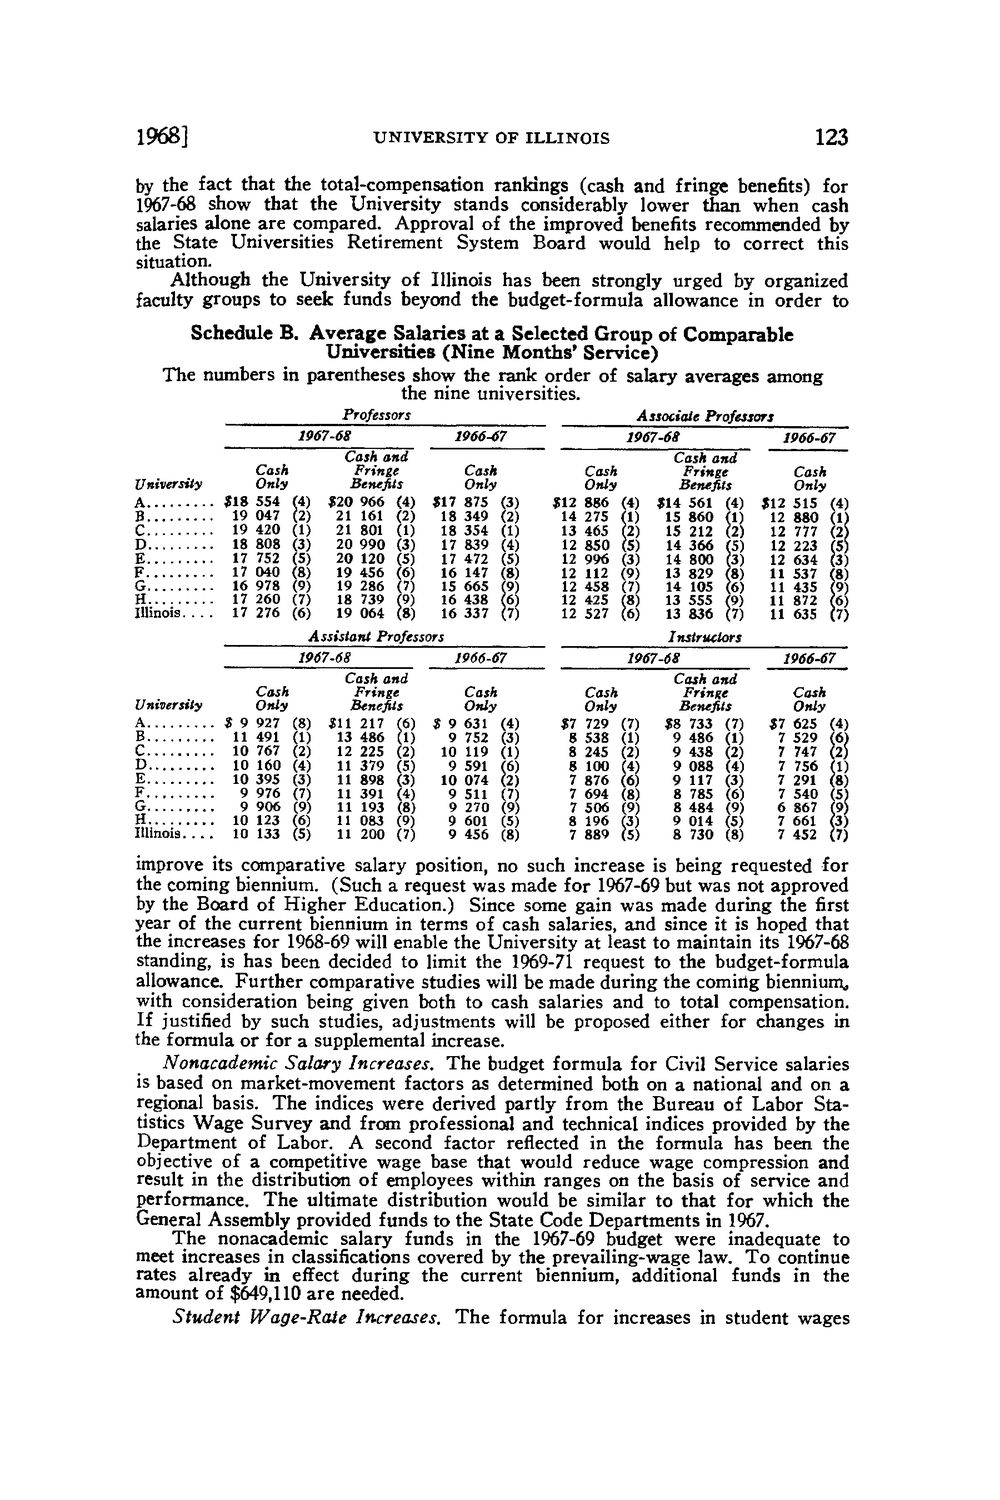
1968] UNIVERSITY OF ILLINOIS 123 by the fact that the total-compensation rankings (cash and fringe benefits) for 1967-68 show that the University stands considerably lower than when cash salaries alone are compared. Approval of the improved benefits recommended by the State Universities Retirement System Board would help to correct this situation. Although the University of Illinois has been strongly urged by organized faculty groups to seek funds beyond the budget-formula allowance in order to Schedule B. Average Salaries at a Selected Group of Comparable Universities (Nine Months' Service) The numbers in parentheses show the rank order of salary averages among the nine universities. Professors 1967-68 1966-67 Cash and Fringe Cash Benefits Only (4) J20 966 (4) « 7 875 (3) (2) 21 161 (2) 18 349 (2) (1) 2 1 8 0 1 (1) 18 354 (1) (3) 20 9 9 0 (3) 17 839 (4) (5) 20 120 (5) 17 472 (5) (8) 19 456 (6) 16 147 (8) (9) 19 286 (7) 15 665 (9) (7) 18 739 (9) 16 438 <6) (6) 19 064 (8) 16 337 (7) Assistant Professors 1967-68 1966-67 Cash and Fringe Cash Benefits Only (8) $ 11 217 (6) J 9 631 (4) (1) 13 486 (1) 9 752 (3) (2) 12 225 (2) 10 119 (1) (4) 11 379 (5) 9 591 (6) (3) 1 1 8 9 8 (3) 10 074 (2) (7) 1 1 3 9 1 (4) 9 511 (7) (9) 1 1 1 9 3 (8) 9 270 (9) (6) 11 083 (9) 9 601 (5) (5) 11 200 (7) 9 456 (8) Associate Professors 1967-68 1966-67 Cask and Fringe Cash Benefits Only (4) « 4 561 (4) J12 515 (4) (1) 15 860 (1) 12 880 (1) (2) 15 212 (2) 12 777 (2) (5) 14 366 (5) 12 223 (5) (3) 14 800 (3) 12 634 (3) (9) 13 829 (8) 1 1 5 3 7 (8) (7) 14 105 (6) 1 1 4 3 5 (9) (8) 13 555 (9) 1 1 8 7 2 (6) (6) 13 836 (7) 11 635 (7) Instructors 1967-68 1966-67 Cash and Fringe Cash Benefits Only (7) J8 733 (7) $7 625 (4) (1) 9 486 (1) 7 529 (6) (2) 9 438 (2) 7 747 (2) (4) 9 088 (4) 7 756 (1) (6) 9 117 (3) 7 291 (8) (8) 8 785 (6) 7 540 (5) (9) 8 484 (9) 6 867 (9) (3) 9 014 (5) 7 661 (3) (5) 8 730 (8) 7 452 (7) University A B C D E F G H Illinois *18 19 19 18 17 17 16 17 17 Cash Only 554 047 420 808 752 040 978 260 276 $12 14 13 12 12 12 12 12 12 Cash Only 886 275 465 850 996 112 458 425 527 University A B C D E F G H Illinois Cash Only J 9 927 11491 10 767 10 160 10 395 9 976 9 906 10 123 10 133 J7 8 8 8 7 7 7 8 7 Cash Only 729 538 245 100 876 694 506 196 889 improve its comparative salary position, no such increase is being requested for the coming biennium. (Such a request was made for 1967-69 but was not approved by the Board of Higher Education.) Since some gain was made during the first year of the current biennium in terms of cash salaries, and since it is hoped that the increases for 1968-69 will enable the University at least to maintain its 1967-68 standing, is has been decided to limit the 1969-71 request to the budget-formula allowance. Further comparative studies will be made during the comirig biennium, with consideration being given both to cash salaries and to total compensation. If justified by such studies, adjustments will be proposed either for changes in the formula or for a supplemental increase. Nonacademic Salary Increases. The budget formula for Civil Service salaries is based on market-movement factors as determined both on a national and on a regional basis. The indices were derived partly from the Bureau of Labor Statistics Wage Survey and from professional and technical indices provided by the Department of Labor. A second factor reflected in the formula has been the objective of a competitive wage base that would reduce wage compression and result in the distribution of employees within ranges on the basis of service and performance. The ultimate distribution would be similar to that for which the General Assembly provided funds to the State Code Departments in 1967. The nonacademic salary funds in the 1967-69 budget were inadequate to meet increases in classifications covered by the prevailing-wage law. To continue rates already in effect during the current biennium, additional funds in the amount of $649,110 are needed. Student Wage-Rate Increases. The formula for increases in student wages
|