Caption: Board of Trustees Minutes - 1888
This is a reduced-resolution page image for fast online browsing.
EXTRACTED TEXT FROM PAGE:
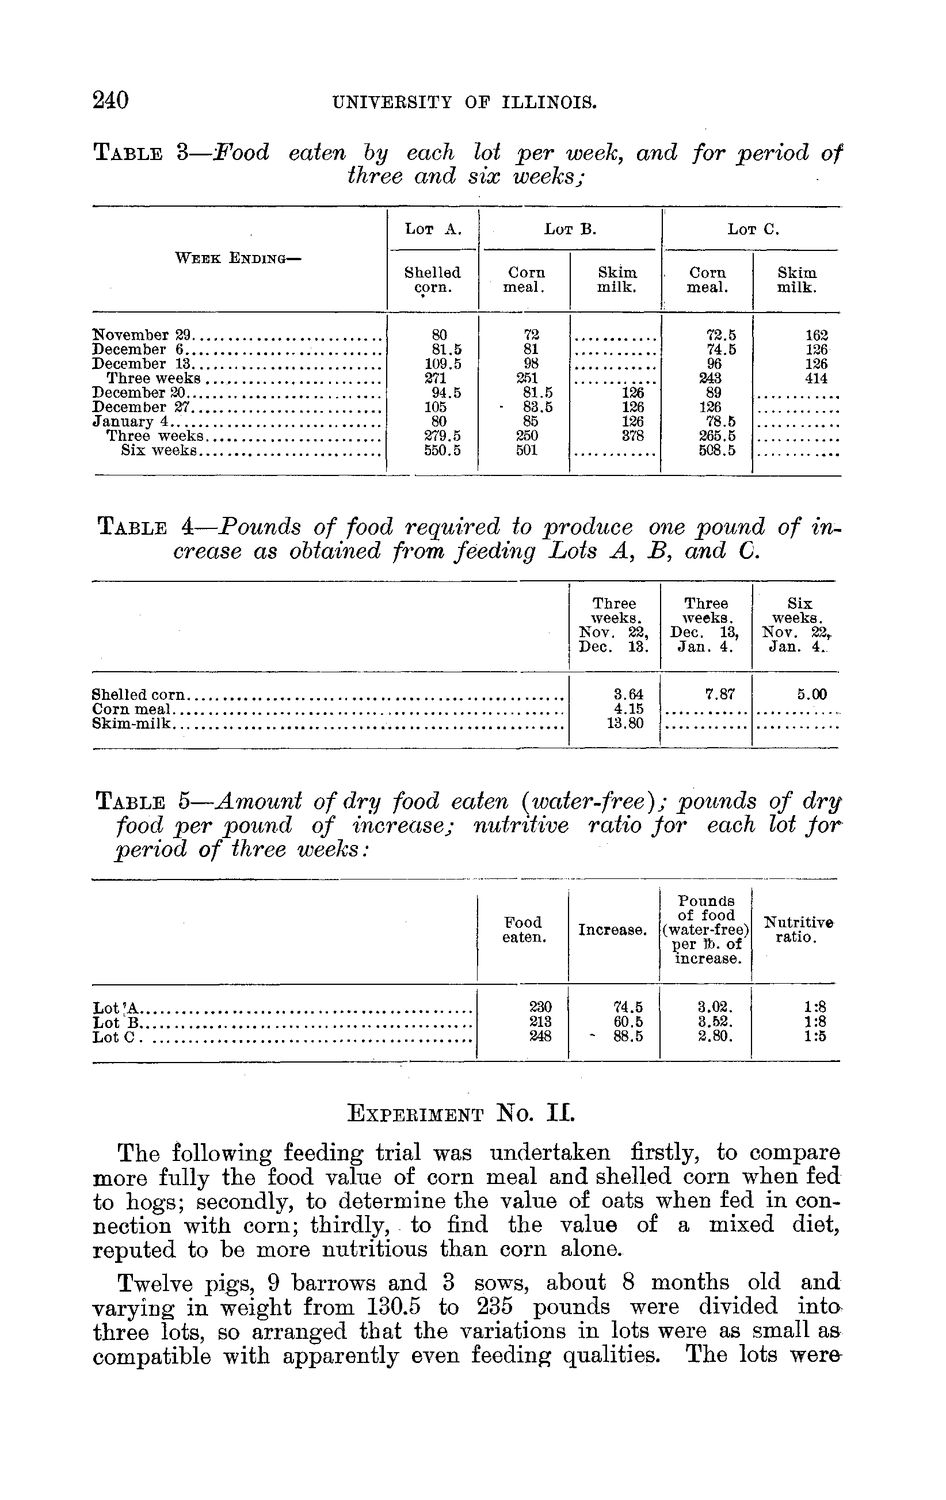
240 TABLE UNIVEESITY OF ILLINOIS. 3—Food eaten by each lot per week, and for period of three and six weeks; LOT A. Corn meal. LOT B. Skim milk. Corn meal. LOT C. Skim milk. 162 126 126 414 W E E K ENDING— Shelled corn. 80 81.5 109.5 271 94.5 105 80 279.5 550.5 November 29 December 6 December 13 Three weeks December 20 December 27 January 4 Three weeks Six weeks 72 81 98 251 81.5 • 83.5 85 250 501 126 126 126 378 72.5 74.5 96 243 89 126 78.5 265.5 508.5 TABLE 4—Pounds of food required to produce one pound of increase as obtained from feeding Lots A, B, and C. Three weeks. Nov. 22, Dec. 13. Three weeks. Dec. 13, J a n . 4. 7.87 Six weeks. Nov. 22,. Jan. 4. 5.00 Shelled corn Skim-milk 3.64 4.15 13.80 TABLE 5—Amount of dry food eaten {water-free); pounds of dry food per pound of increase; nutritive ratio for each lot for period of three weeks: Food eaten. Pounds of food Increase. (water-free) per lb. of increase. 74.5 60.5 88.5 3.02. 3.52. 2.80. Nutritive ratio. Lot ? A Lot B Lot C 230 213 248 - 1:8 1:8 1:5 EXPERIMENT N O . II. The following feeding trial was undertaken firstly, to compare more fully the food value of corn meal and shelled corn when fed to hogs; secondly, to determine the value of oats when fed in connection with corn; thirdly, to find the value of a mixed diet, reputed to be more nutritious than corn alone. Twelve pigs, 9 barrows and 3 sows, about 8 months old and varying in weight from 130.5 to 235 pounds were divided into three lots, so arranged that the variations in lots were as small as compatible with apparently even feeding qualities. The lots were
|