Caption: Board of Trustees Minutes - 1884
This is a reduced-resolution page image for fast online browsing.
EXTRACTED TEXT FROM PAGE:
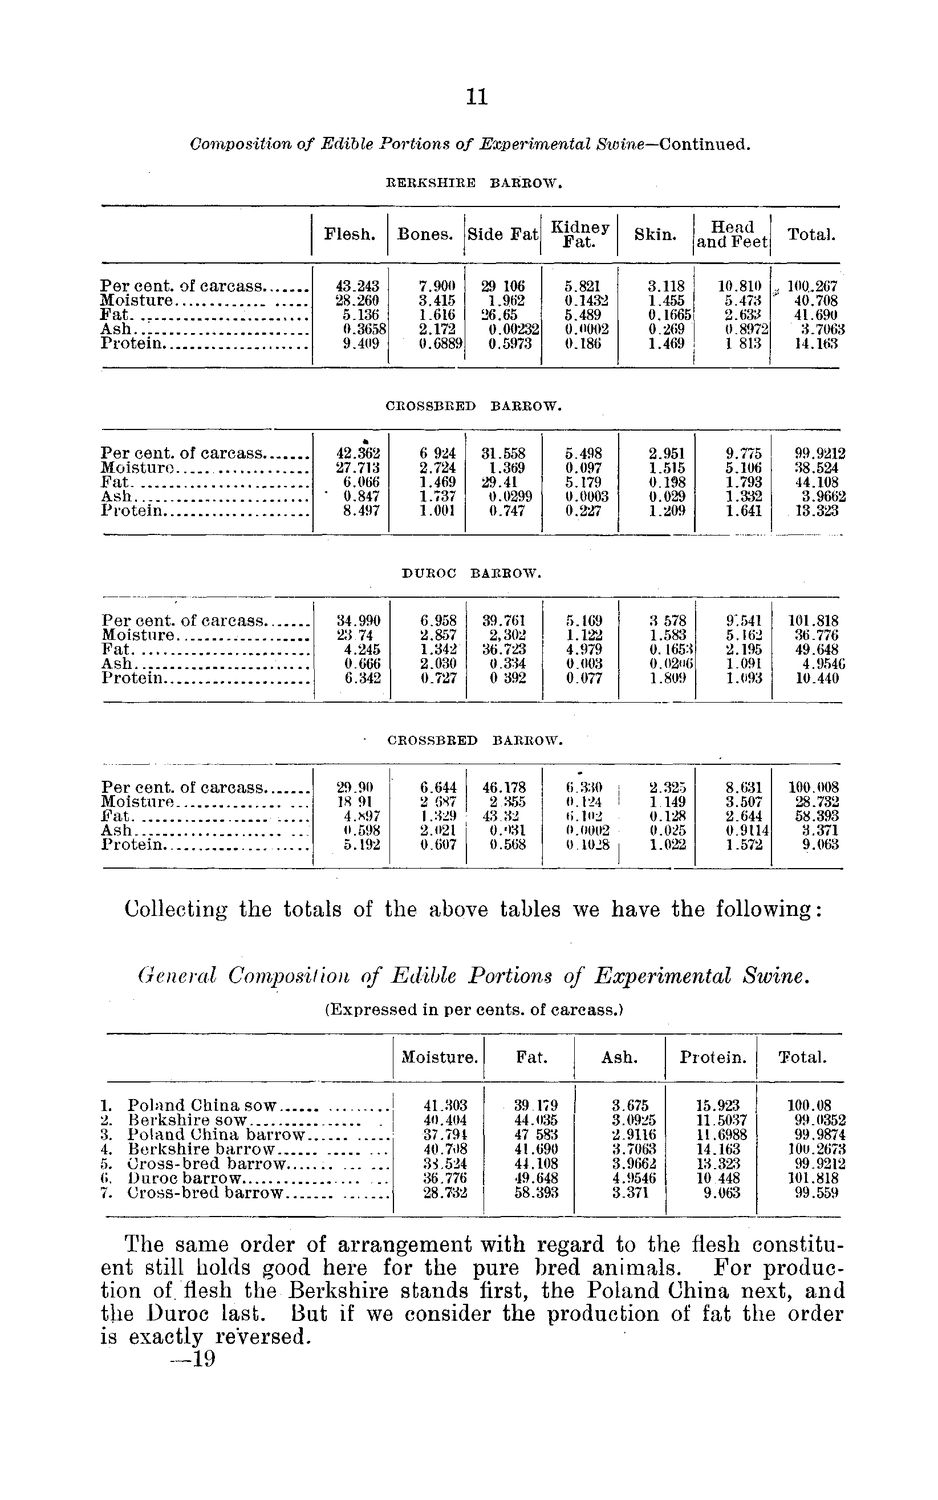
11 Composition of Edible Portions of Experimental EEEKSHIEE BAEEOW. K Swine—Continued. Flesh. Per cent, of carcass... Moisture Fat Ash..l Protein 43.243 28.260 5.136 0.3658 9.409 Bones. Side Fatl 7.900 3.415 1.616 2.172 0.6889 29 106 1.962 26.65 0.00232 0.5973 |? a n t e y 5.821 0.1432 5.489 0.O002 0.186 Skin. 3.118 1.455 0.1665 0.269 1.469 Head and Feet 10.810 5.473 2.633 0.8972 1 813 Total. 100.267 40.708 41.690 3.7063 14.163 CEOSSBEED BAEEOW. 31.558 1.369 29.41 0.0299 0.747 5.498 0.097 5.179 0.0003 0.227 2.951 1.515 0.198 0.029 1.209 9.775 5.106 1.793 1.332 1.641 Per cent, of carcass, Moisture Fat Ash Protein 42.362 27.713 6.066 • 0.847 8.497 6 924 2.724 1.469 1.737 1.001 99.9212 38.524 44.108 3.9662 13.323 DUEOC BAEEOW. 34.990 23 74 4.245 0.666 6.342 6.958 2.857 1.342 2.030 0.727 39.761 2,302 36.723 0.334 0 392 5.169 1.122 4.979 0.003 0.077 3 578 1.583 0.1653 0.02*16 1.809 9*. 541 5.162 2.195 1.091 1.093 101.818 36.776 49.648 4.9546 10.440 Moisture Fat Ash Protein CEOSSBEED BAEEOW. 29.90 18 91 4.K97 0.598 5.192 6.644 2 6S7 1.329 2.021 0.607 46.178 2 355 43 32 0.031 0.568 6.330 0.124 I 6.102 j 0.0002 0.1028 2.325 1 149 0.128 0.025 1.022 8.631 3.507 2.644 0.9114 1.572 100.008 28.732 58.393 3.371 9.063 Ash Protein Collecting the totals of the ahove tables we have the following: General Composition of Edible Portions of Experimental (Expressed in per cents, of carcass.) Moisture. Fat. 39 179 44.035 47 583 41.690 44.108 49.648 58.393 Ash. 3.675 3.0925 2.9116 3.7063 3.9662 4.9546 3.371 Protein. 15.923 11.5037 11.6988 14.163 13.323 10 448 9.063 Total. 100.08 99.0352 99.9874 100.2673 99.9212 101.818 99.559 Swine. 1. P o l a n d China sow 2. 3. Berkshire sow Poland China barrow 7. Cross-bred barrow 41.303 40.404 37.794 40.708 3S.524 36.776 28.732 The same order of arrangement with regard to the flesh constituent still holds good here for the pure bred animals. For production of flesh the Berkshire stands first, the Poland China next, and the Duroc last. But if we consider the production of fat the order is exactly reversed. —19
|