Caption: Map of UIUC (2004) (Campus Retail Assessment)
This is a reduced-resolution page image for fast online browsing.
EXTRACTED TEXT FROM PAGE:
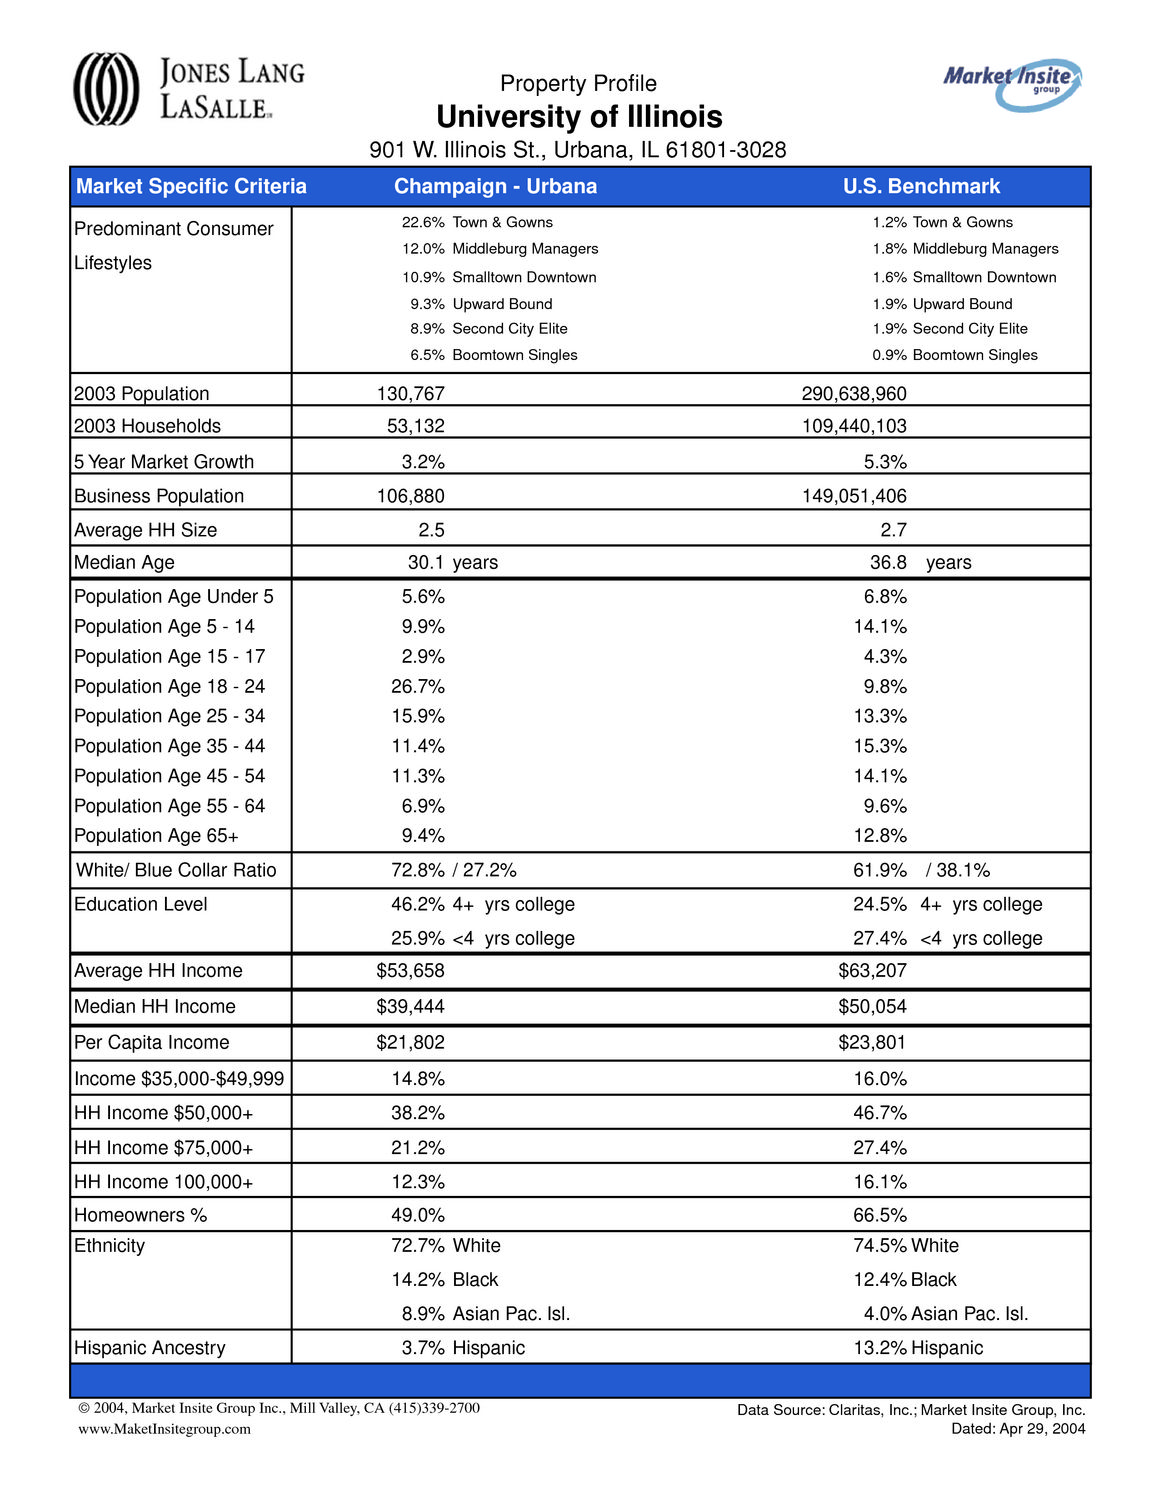
Property Profile University of Illinois 901 W. Illinois St., Urbana, IL 61801-3028 Market Specific Criteria Predominant Consumer Lifestyles Champaign - Urbana 22.6% Town & Gowns 12.0% Middleburg Managers 10.9% Smalltown Downtown 9.3% Upward Bound 8.9% Second City Elite 6.5% Boomtown Singles U.S. Benchmark 1.2% Town & Gowns 1.8% Middleburg Managers 1.6% Smalltown Downtown 1.9% Upward Bound 1.9% Second City Elite 0.9% Boomtown Singles 2003 Population 2003 Households 5 Year Market Growth Business Population Average HH Size Median Age Population Age Under 5 Population Age 5 - 14 Population Age 15 - 17 Population Age 18 - 24 Population Age 25 - 34 Population Age 35 - 44 Population Age 45 - 54 Population Age 55 - 64 Population Age 65+ White/ Blue Collar Ratio Education Level 130,767 53,132 3.2% 106,880 2.5 30.1 years 5.6% 9.9% 2.9% 26.7% 15.9% 11.4% 11.3% 6.9% 9.4% 72.8% / 27.2% 46.2% 4+ yrs college 25.9% <4 yrs college 290,638,960 109,440,103 5.3% 149,051,406 2.7 36.8 years 6.8% 14.1% 4.3% 9.8% 13.3% 15.3% 14.1% 9.6% 12.8% 61.9% / 38.1% 24.5% 4+ yrs college 27.4% <4 yrs college $63,207 $50,054 $23,801 16.0% 46.7% 27.4% 16.1% 66.5% 74.5% White 12.4% Black 4.0% Asian Pac. Isl. 13.2% Hispanic Data Source: Claritas, Inc.; Market Insite Group, Inc. Dated: Apr 29, 2004 Average HH Income Median HH Income Per Capita Income Income $35,000-$49,999 HH Income $50,000+ HH Income $75,000+ HH Income 100,000+ Homeowners % Ethnicity $53,658 $39,444 $21,802 14.8% 38.2% 21.2% 12.3% 49.0% 72.7% White 14.2% Black 8.9% Asian Pac. Isl. Hispanic Ancestry 3.7% Hispanic © 2004, Market Insite Group Inc., Mill Valley, CA (415)339-2700 www.MaketInsitegroup.com
|