| |
| |
Caption: Board of Trustees Minutes - 1932
This is a reduced-resolution page image for fast online browsing.
EXTRACTED TEXT FROM PAGE:
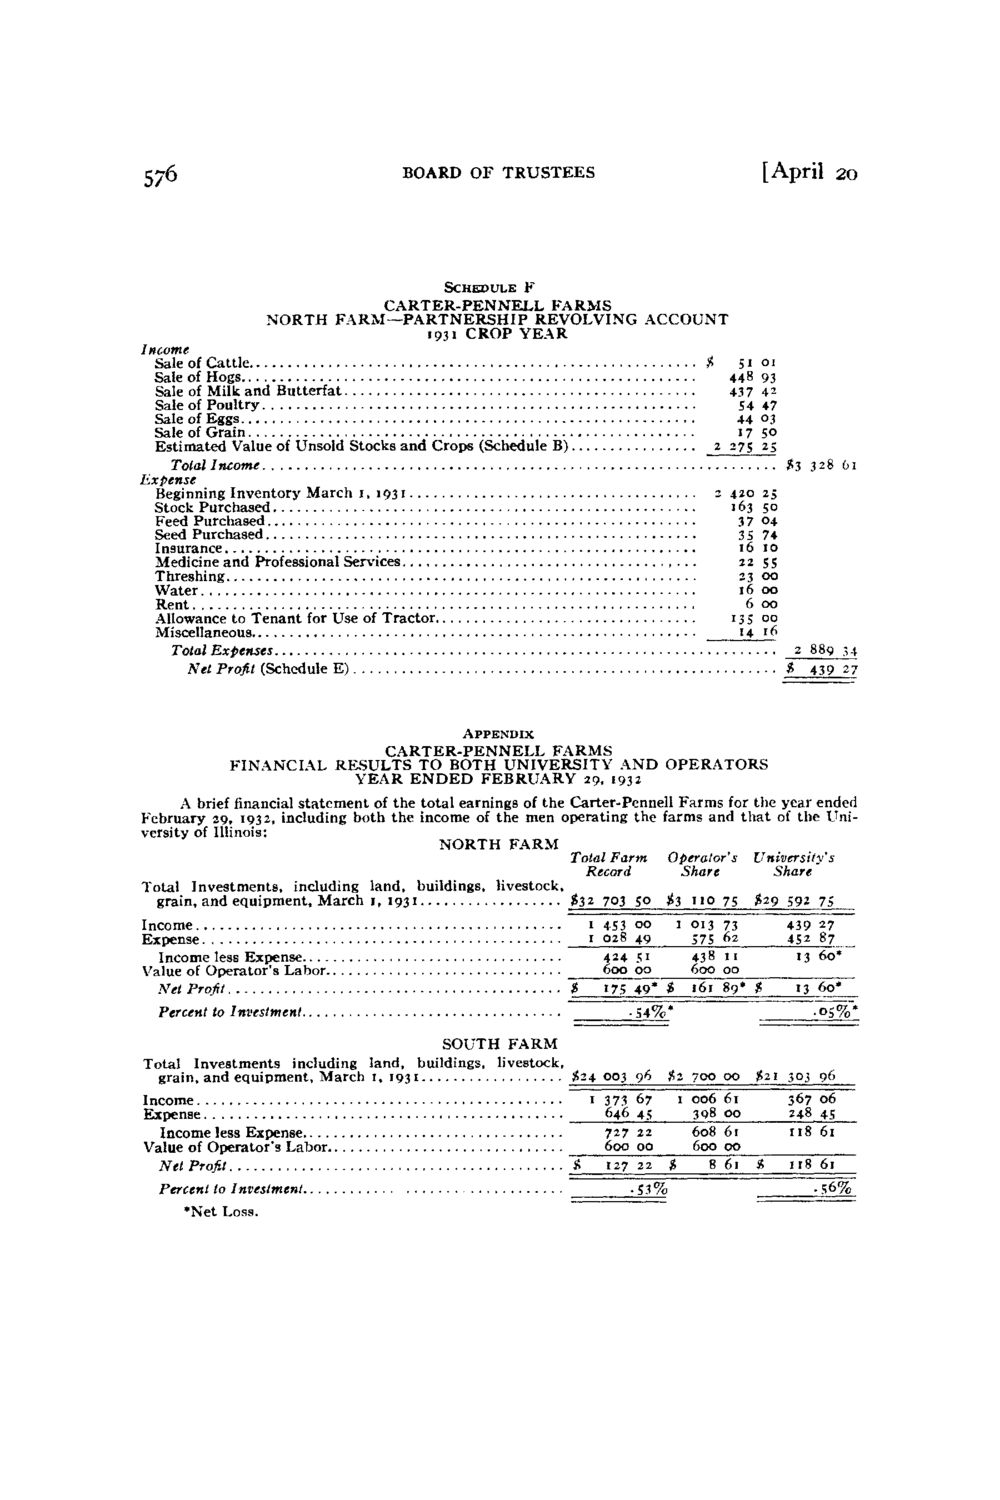
5/6 BOARD OF TRUSTEES [April 20 Schedule F CARTER-PENNELL FARMS NORTH FARM—PARTNERSHIP REVOLVING ACCOUNT 1931 CROP YEAR Income Sale of Cattle t 51 01 Sale of Hogs 44B 93 Sale of Milk and Butterfat +37 4* Sale of Poultry 54 47 Sale of Eggs 44 03 Sale of Grain 17 50 Estimated Value of Unsold Stocks and Crops (Schedule B) 2 275 25 Total Income *3 328 61 Expense Beginning Inventory March 1, 1931 2 420 2; Stock Purchased 163 50 Feed Purchased 37 04 Seed Purchased 35 74 Insurance 1610 Medicine and Professional Services 22 55 Appendix Threshing 23 00 CARTER-PENNELL FARMS Water 16 00 FINANCIAL R E S U L T S T O B O T H UNIVERSITY A N D O P E R A T O R S Rent 6 00 Y E A R E N D E D F E B R U A R Y 29, 1932 13 00 A Allowance to Tenant for Use of of the total earnings of the Carter-PennellS Farms for the year ended brief financial statement Tractor Miscellaneous February 29, 1932, including both the income of the men operating the farms and 14 r6 of the Unithat Total Illinois: 2 889 34 versity of Expenses Net Profit (Schedule E) $ 439 27 NORTH FARM Total Farm Operator's University's Record Share Share Total Investments, including land, buildings, livestock, grain, and equipment, March 1, 1931 $32 703 50 jj n o 75 $29 592 75 Income 1 453 00 1 013 73 439 27 Expense 1 oz8 49 575 62 452 87 SOUTH F A R M Income less Expense 424 51 43 8 1' '3 60* Total Investments including land, buildings, livestock, Value of Operator's Labor March I, 193 1 600 00 600 00 grain, and equipment, £24 003 96 $2 700 00 $21 303 96 Net Profit $ 175 49* $ <6i 89* $ 13 6o* Income 1 373 67 1 006 61 367 06 Percent to Investment . S4%* -oS%* Expense 646 45 398 00 248 45 Incomeless Expense 727 22 608 6r 118 61 Value of Operator's Labor 600 00 600 00 Net Profit t 127 22 $ g 61 H 118 61 Percent to Investment .5.1% -56% •Net Loss.
| |