Caption: Board of Trustees Minutes - 1920
This is a reduced-resolution page image for fast online browsing.

EXTRACTED TEXT FROM PAGE:
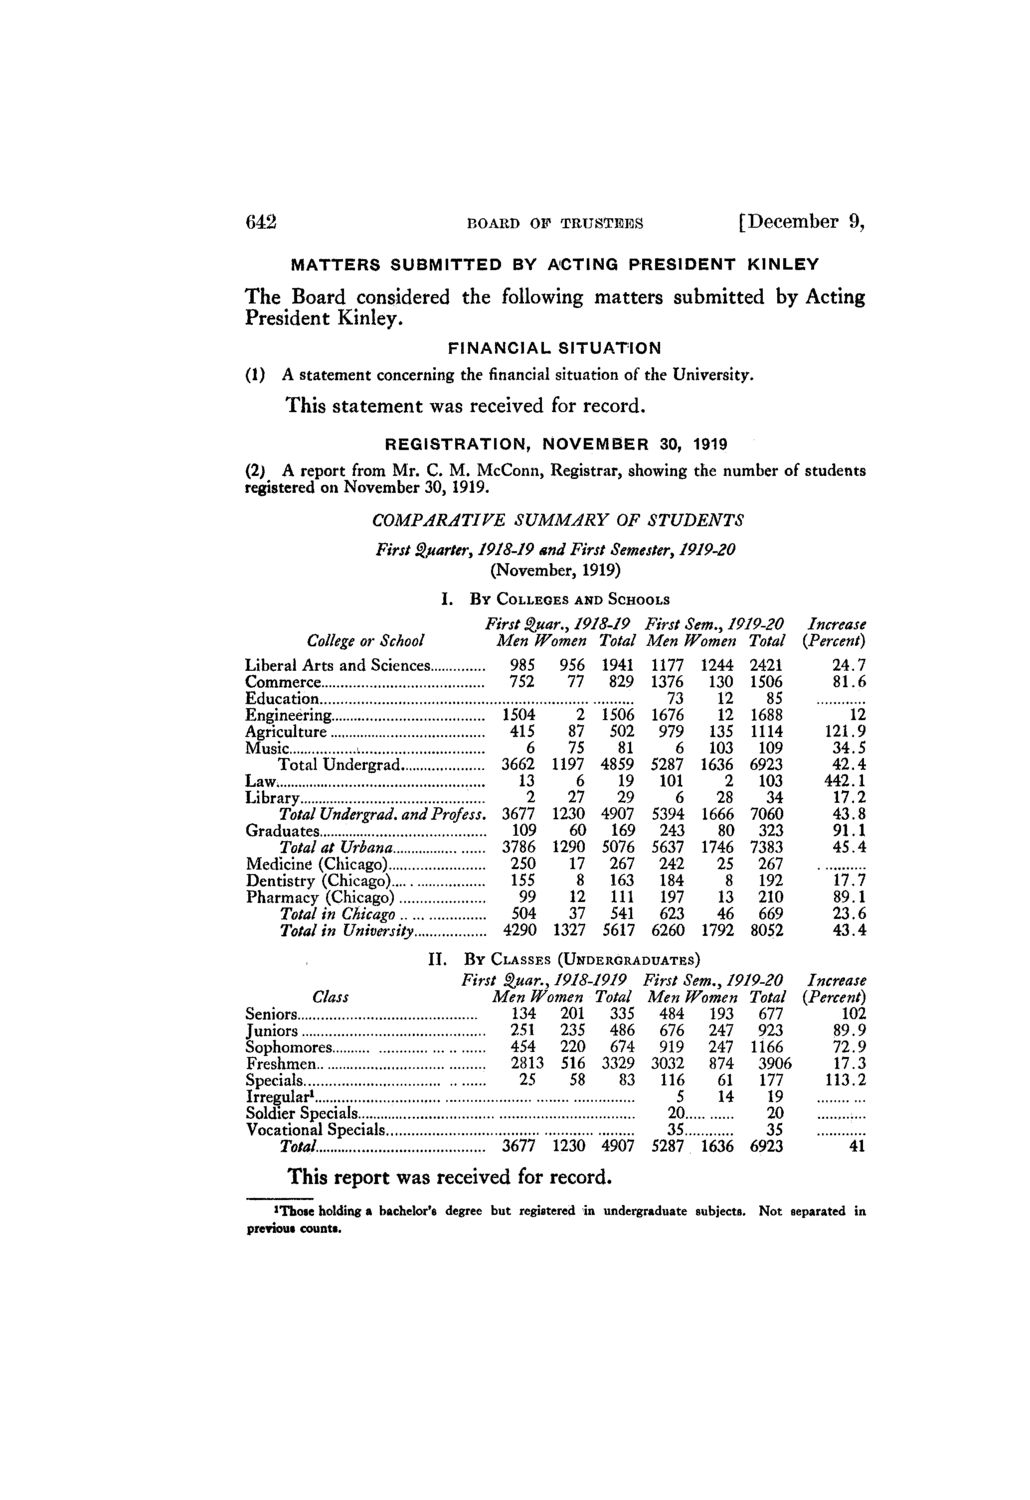
642 BOARD OF TRUSTEES MATTERS SUBMITTED BY ACTING PRESIDENT [December 9, KINLEY The Board considered the following matters submitted by Acting President Kinley. F I N A N C I A L SITUATION (1) A statement concerning the financial situation of the University. This statement was received for record. REGISTRATION, NOVEMBER 30, 1919 (2) A report from Mr. C. M. McConn, Registrar, showing the number of students registered on November 30, 1919. COMPARATIVE SUMMARY OF STUDENTS First Quarter, 19/8-19 and First Semester, 1919-20 (November, 1919) I. B Y COLLEGES AND SCHOOLS First $,uar.y 1918-19 College or School Men Women Total Liberal Arts and Sciences 985 956 1941 Commerce 752 77 829 Education , Engineering 1504 2 1506 Agriculture 415 87 502 Music i 6 75 81 Total Undergrad 3662 1197 4859 Law. 13 6 19 Library 2 27 29 Total Undergrad. and Profess. 3677 1230 4907 Graduates 109 60 169 Total at Urbana 3786 1290 5076 Medicine (Chicago) 250 17 267 Dentistry (Chicago) 155 8 163 Pharmacy (Chicago) 99 12 111 Total in Chicago 504 37 541 Total in University 4290 1327 5617 II. First Sem., 1919-20 Men Women Total 1177 1244 2421 1376 130 1506 73 12 85 1676 12 1688 979 135 1114 6 103 109 5287 1636 6923 101 2 103 6 28 34 5394 1666 7060 243 80 323 5637 1746 7383 242 25 267 184 8 192 197 13 210 623 46 669 6260 1792 8052 Increase (Percent) 24.7 81.6 12 121.9 34.5 42.4 442.1 17.2 43.8 91.1 45.4 17.7 89.1 23.6 43.4 B Y CLASSES (UNDERGRADUATES) Class Seniors Juniors Sophomores Freshmen Specials Irregular1 Soldier Specials Vocational Specials Total First Quar.y 1918-1919 First Sem., 1919-20 Increase Men Women Total Men Women Total {Percent) 134 201 335 484 193 677 102 251 235 486 676 247 923 89.9 454 220 674 919 247 1166 72.9 2813 516 3329 3032 874 3906 17.3 25 58 83 116 61 177 113.2 5 14 19 20 20 ... 35 35 .... 3677 1230 4907 5287 1636 6923 41 This report was received for record. 'Those holding a bachelor's degree but registered in undergraduate subjects. Not separated in previous counts.
|