Caption: Board of Trustees Minutes - 1890
This is a reduced-resolution page image for fast online browsing.
EXTRACTED TEXT FROM PAGE:
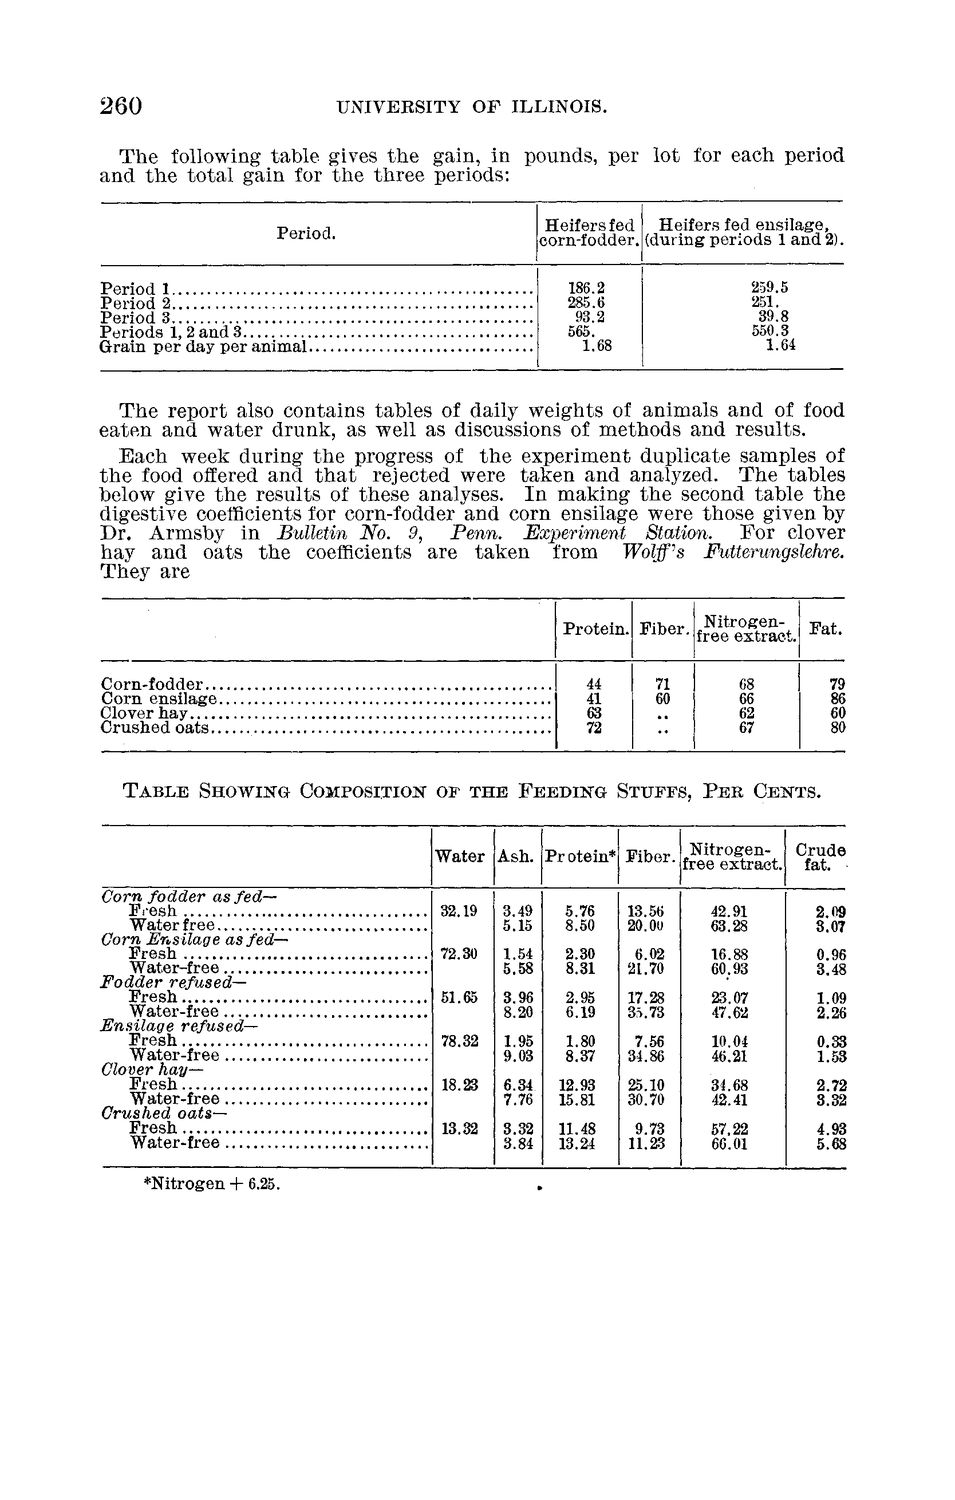
260 UNIVERSITY OF ILLINOIS. The following table gives the gain, in pounds, per lot for each period and the total gain for the three periods: Period. Period 1 Period 2 Period 3 P e r i o d s 1, 2 a n d 3 G r a i n p e r day p e r animal Heifers fed Heifers fed ensilage, corn-fodder, (during p e r i o d s 1 a n d 2). 186.2 285.6 93.2 565. 1.68 259.5 251. 39.8 550.3 1.64 The report also contains tables of daily weights of animals and of food eaten and water drunk, as well as discussions of methods and results. Each week during the progress of the experiment duplicate samples of the food offered and t h a t rejected were taken and analyzed. The tables below give the results of these analyses. I n making the second table the digestive coefficients for corn-fodder and corn ensilage were those given by Dr. Armsby in Bulletin No. 9, Penn. Experiment Station. For clover hay and oats the coefficients are taken from Wolff^s Futterungslehre. They are NitrogenProtein. Fiber. free extract. Fat. Corn-fodder.. Corn ensilage Clover hay Crushed oats.. 44 41 72 71 60 68 67 79 86 60 T A B L E SHOWING COMPOSITION OF T H E F E E D I N G STUFFS, P E R CENTS. Ni ogenru W a t e r Ash. P r otein* F i b e r . freet rextract. Cfat.d e Corn fodder as fedFresh W a t e r free Corn Ensilage as fedFresh Water-free Fodder refusedFresh Water-free Ensilage refusedFresh Water-free Clover hayFresh Water-free Crushed oatsFresh Water-free 32.19 72.30 51.65 78.32 18.23 13.32 3.49 5.15 1.54 5.58 3.96 8.20 1.95 9.03 6.34 7.76 3.32 3.84 5.76 8.50 2.30 8.31 2.95 6.19 1.80 8.37 12.93 15.81 11.48 13.24 13.56 20.00 6.02 21.70 17.28 35.73 7.56 34.86 25.10 30.70 9.73 11.23 42.91 63.28 16.88 60.93 23.07 47.62 10.04 46.21 34.68 42.41 57,22 66.01 2 09 3 07 0 96 3 48 1 09 2 26 0 33 1 53 2 72 3 32 4 93 5 68 *Nitrogen + 6.25.
|