Caption: Board of Trustees Minutes - 1888
This is a reduced-resolution page image for fast online browsing.
EXTRACTED TEXT FROM PAGE:
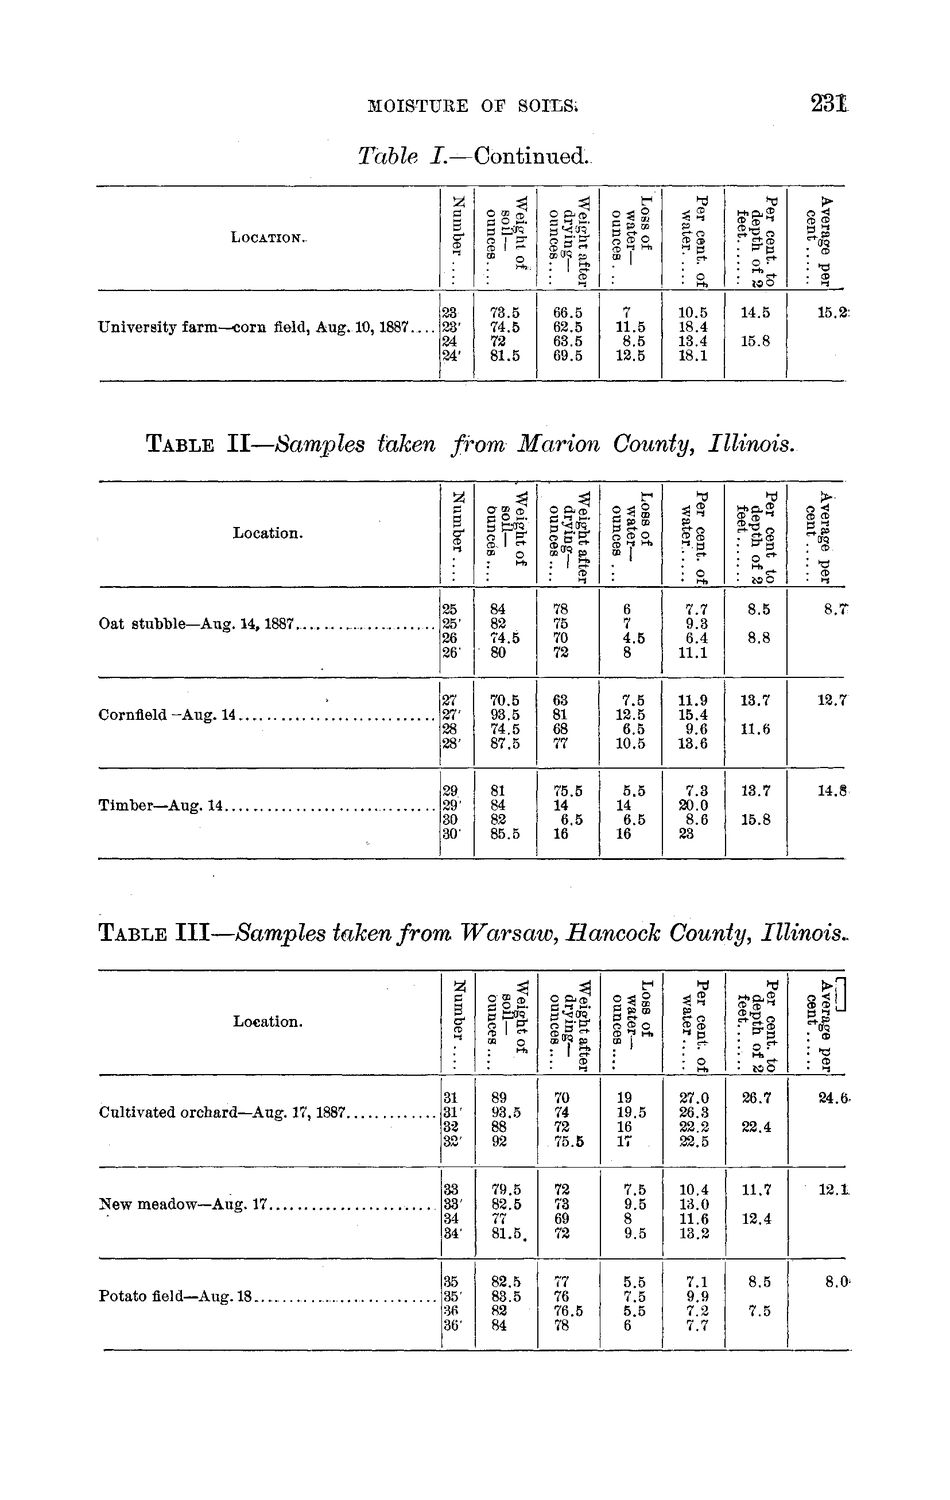
MOISTURE OF SOILS* 231 Table I.—Continued. 3 t-1' hi hd > Weight c soilounces Weight a dryingounces oss of waterounces er cent water. er cent depth ( feet... verage cent .. umber LOCATION. • U n i v e r s i t y f a r m — c o r n field, A u g . 10,1887 23 23' 24 24' : >-*».. • 1 £? • H» • too 14.5 15.8 • a> • <-i . v 73.5 74.5 72 81.5 66.5 62.5 63.5 69.5 7 11.5 8.5 12.5 10.5 18.4 13.4 18.1 15.2: TABLE II—Samples taken from Marion County, Illinois. , Weight of soilounces Weight after drying— ounces.... Per cent, of Per cent to depth of 2 Average per Number Loss of water— ounces ... Location. O a t s t u b b l e — A u g . 14,1887 25 25' 26 26' 27 27' 28 28' 29 29' 30 30' 84 82 74.5 80 70.5 93.5 74.5 87.5 81 84 82 85.5 78 75 70 72 63 81 68 77 75.5 14 6.5 16 6 7 4.5 8 7.5 12.5 6.5 10.5 5.5 14 6.5 16 7.7 9.3 6.4 11.1 11.9 15.4 9.6 13.6 7.3 20.0 8.6 23 8.5 8.8 8.7 13.7 11.6 12.7 Cornfield —Aug. 14 13.7 15.8 14.8 T i m b e r — A u g . 14 TABLE III—Samples taken from Warsaw, Hancock County, Illinois., 2 3 £j t-1 •tf •d >r\ r r eight a dryingounces OS8 Of er cent water. er cent depth feet... verage cent .. umber eight o soil— ounces waterounces Location. : H»' C u l t i v a t e d o r c h a r d — A u g . 17,1887 31 31' 32 32' 33 33' 34 34' 35 36' 36 36' 89 93.5 88 92 79.5 82.5 77 81.5. 82.5 83.5 82 84 : 1 2 C D • o 19 19.5 16 17 7.5 9.5 8 9.5 27.0 26.3 22.2 22.5 10.4 13.0 11.6 13.2 : v • wo 26.7 22.4 :° 24.6, 70 74 72 75.5 72 73 69 72 77 76 76.5 78 11.7 12.4 12.1 P o t a t o field—Aug. 1 8 . . 5.5 7.5 5.5 6 7.1 9.9 7.2 7.7 8.5 7.5 8.0'
|