| |
| |
Caption: Booklet - Engineering Experiment Station and Industry (1909)
This is a reduced-resolution page image for fast online browsing.
EXTRACTED TEXT FROM PAGE:
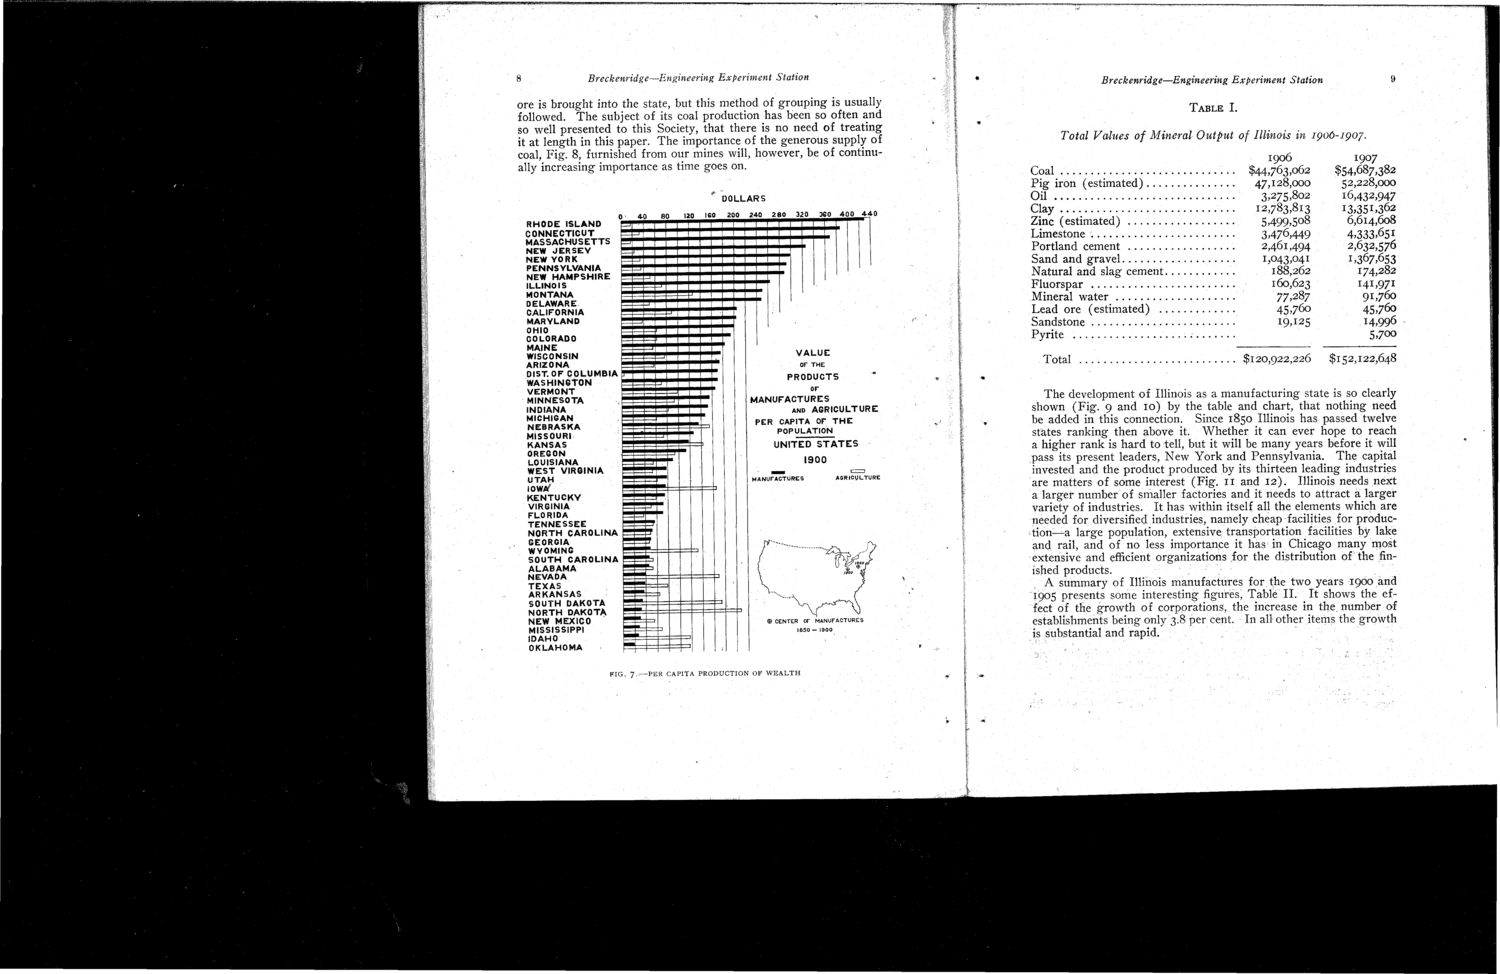
8 Breckenridge—Engineering Experiment Station Breckenridge—Engineering Experiment Station TABLE I. 9 ore is brought into the state, but this method of grouping is usually followed. The subject of its coal production has been so often and so well presented to this Society, that there is no need of treating it at length in this paper. The importance of the generous supply of coal, Fig. 8, furnished from our mines will, however, be of continually increasing importance as time goes on. DOLLARS IG O 200 240 280 320 360 400 440 Total Values of Mineral Output of Illinois in 1906-1907. Coal . Pig iron (estimated) Oil Clay Zinc (estimated) Limestone Portland cement Sand and gravel Natural and slag cement ........ Fluorspar Mineral water Lead ore (estimated) Sandstone . . .......... 1906 $44,763,062 47,128,000 3, 2 753o2 12,783,813 5,499,508 3,476,449 2,461,494 1,043,041 188,262 160,623 77^7 45,7 6 o 19,125 $120,922,226 RHODE ISLAND CONNECTICUT MASSACHUSETTS NEW JERSEY NEW YORK PENNSYLVANIA NEW HAMPSHIRE ILLINOIS MONTANA DELAWARE CALIFORNIA MARYLAND OHIO COLORADO MAINE WISCONSIN ARIZONA OIST. OF COLUMBIA WASHINGTON VERMONT MINNESOTA INDIANA MICHIGAN NEBRASKA MISSOURI KANSAS OREGON LOUISIANA WEST VIRGINIA UTAH IOWA/ KENTUCKY VIRGINIA FLORIDA TENNESSEE NORTH CAROLINA GEORGIA WYOMING SOUTH CAROLINA ALABAMA NEVADA TEXAS ARKANSAS SOUTH DAKOTA NORTH DAKOTA NEW MEXICO MISSISSIPPI IDAHO OKLAHOMA 1907 $54,687,382 52,228,000 16,432,947 13,351,362 6,614,608 4,333,65* 2,632,576 1,367,653 174,282 141,97! 9^7^ 45,76o H,996 Pyrite VALUE Of THE .. .. 5,7°° $152,122,648 Total . . . . . PRODUCTS or MANUFACTURES AND AGRICULTURE PER CAPITA OF T H E POPULATION UNITED S T A T E S 1900 MANUFACTURES AGRICULTURE )CENTER OF MANUFACTURES 1850 - 1900 The development of Illinois as a manufacturing state is so clearly shown (Fig. 9 and 10) by the table and chart, that nothing need be added in this connection. Since 1850 Illinois has passed twelve states ranking then above it. Whether it can ever hope to reach a higher rank is hard to tell, but it will be many years before it will pass its present leaders, New York and Pennsylvania. The capital invested and the product produced by its thirteen leading industries are matters of some interest (Fig. 11 and 12). Illinois needs next a larger number of smaller factories and it needs to attract a larger variety of industries. It has within itself all the elements which are needed for diversified industries, namely cheap facilities for production—a large population, extensive transportation facilities by lake and rail, and of no less importance it has in Chicago many most extensive and efficient organizations for the distribution of the finished products. A summary of Illinois manufactures for the two years 1900 and 1905 presents some interesting figures, Table II. It shows the effect of the growth of corporations, the increase in the number of establishments being only 3.8 per cent. In all other items the growth is substantial and rapid. FIG, 7-.—PER CAPITA PRODUCTION OF WEALTH
| |