| |
| |
Caption: SWE - Proceedings of the First International Conference of Women Engineers and Scientists
This is a reduced-resolution page image for fast online browsing.

EXTRACTED TEXT FROM PAGE:
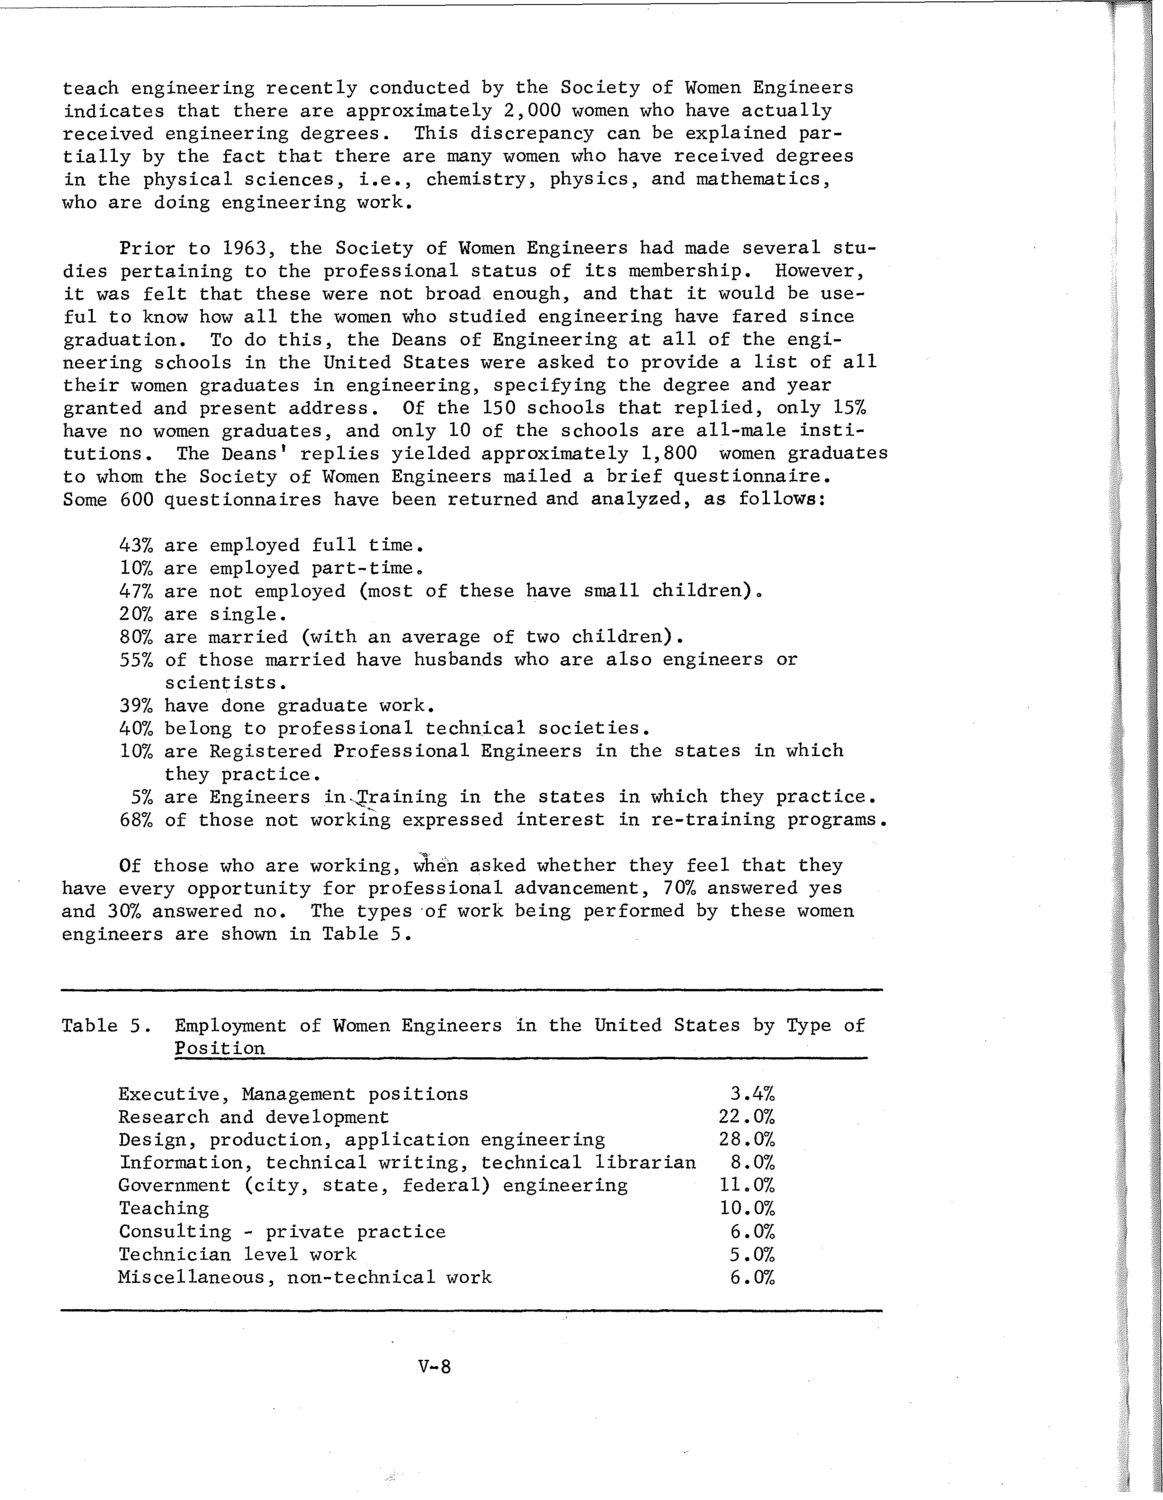
teach engineering recently conducted by the Society of Women Engineers indicates that there are approximately 2,000 women who have actually received engineering degrees. This discrepancy can be explained partially by the fact that there are many women who have received degrees in the physical sciences, i.e., chemistry, physics, and mathematics, who are doing engineering work. Prior to 1963, the Society of Women Engineers had made several studies pertaining to the professional status of its membership. However, it was felt that these were not broad enough, and that it would be useful to know how all the women who studied engineering have fared since graduation. To do this, the Deans of Engineering at all of the engineering schools in the United States were asked to provide a list of all their women graduates in engineering, specifying the degree and year granted and present address. Of the 150 schools that replied, only 15% have no women graduates, and only 10 of the schools are all-male institutions. The Deans' replies yielded approximately 1,800 women graduates to whom the Society of Women Engineers mailed a brief questionnaire. Some 600 questionnaires have been returned and analyzed, as follows: 43% 10% 47% 20% 80% 55% are employed full time. are employed part-time, are not employed (most of these have small children). are single. are married (with an average of two children). of those married have husbands who are also engineers or scientists. 39%, have done graduate work. 40% belong to professional technical societies. 10% are Registered Professional Engineers in the states in which they practice. 5% are Engineers in^Training in the states in which they practice. 68% of those not working expressed interest in re-training programs. Of those who are working, when asked whether they feel that they have every opportunity for professional advancement, 70% answered yes and 30% answered no. The types of work being performed by these women engineers are shown in Table 5. Table 5. Employment of Women Engineers in the United States by Type of Position Executive, Management positions Research and development Design, production, application engineering Information, technical writing, technical librarian Government (city, state, federal) engineering Teaching Consulting - private practice Technician level work Miscellaneous, non-technical work 3.4% 22.0% 28.07o 8.0% 11.0% 10.0% 6.0% 5.0% 6.0% V-8
| |